
I wanted students to be able to apply what they were learning to the local context within which they live, work, play and study.
–John Paul Catungal, Instructor of the Institute for Gender, Race, Sexuality and Social Justice
Back Story
One of the assignments that I tasked my students with for GRSJ 200 (Gender and Environmental Justice) is identify a local example of environmental injustice and to provide a description and analysis of it that is appropriate for public audiences. The activity was hosted on a UBC Blogs site and students pinpointed their locations of interest on Google Maps, along with their descriptions.
Why did you think it was important for students to engage in this activity (public creation of knowledge and mapping)?
There were a couple of pedagogical reasons for this assignment. First, I wanted students to be able to apply what they were learning to the local context within which they live, work, play, study, etc. I wanted them to see the relevance of the course, which is why I asked them to link course material to their everyday lives and environments through the analysis of local examples. Second, I wanted students to be able to understand that knowledge production comes in many forms and can be geared towards multiple audiences. Writing for the public as an academic task is different from writing a term paper. The genre is different in part because the audience is different. I wanted students to appreciate that what we do here, in this university, is also of concern for folks outside the university, and that it is therefore important for us to be able to bridge the university and the community. This is especially relevant for an issue like environmental justice, which has its origins as an approach to environmental issues in community-based knowledge production.
What ideas or forms of approaches did you have in mind?
From the very beginning, I wanted this assignment to include a visual and interactive component. I wanted, by the end of the term, to have a map of Greater Vancouver with about 80 points that users can interact with, where each point corresponds to a local environmental justice issue. The content of the map – i.e., each point on the map – will be student-generated examples that users can click and be introduced to the diversity of environmental justice issues in Greater Vancouver.
What has been the result?
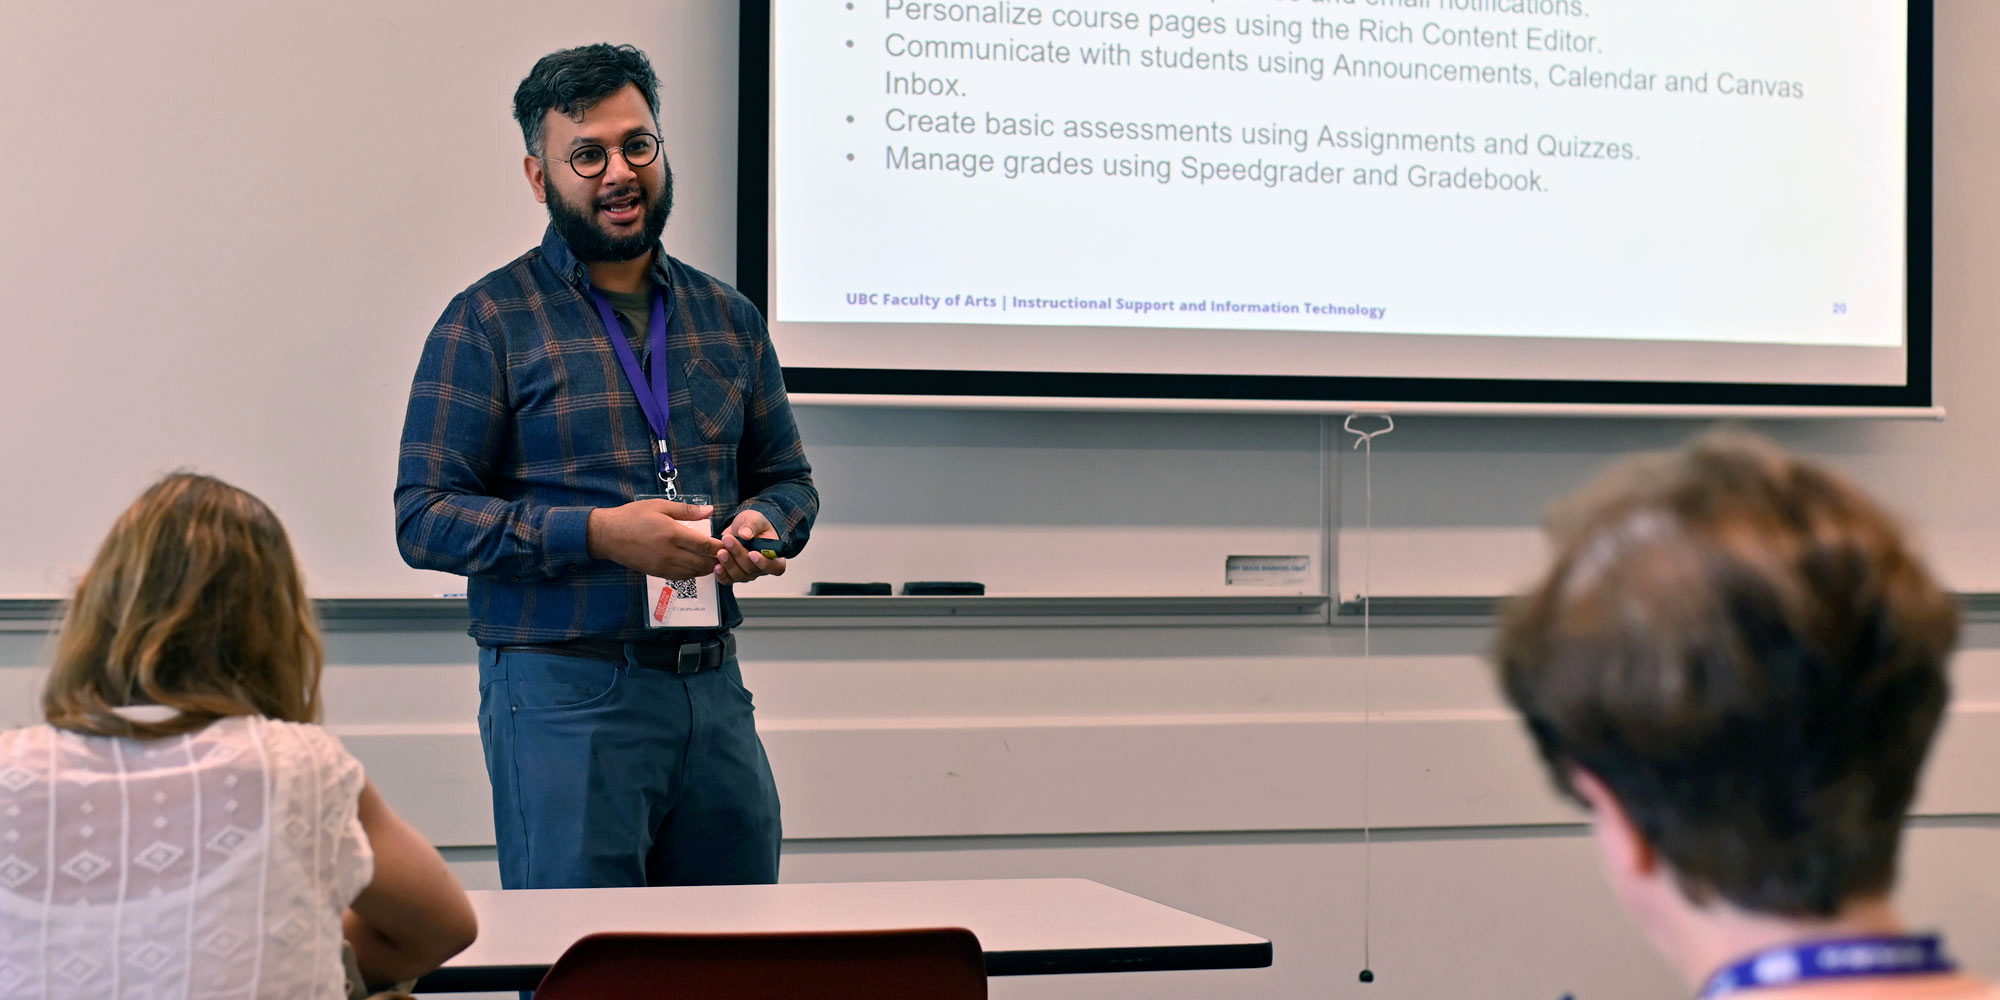
I contacted Arts ISIT and set up a meet-and-greet and pitch meeting with them. In the meeting, I introduced my idea and the pedagogical goals of the assignment. They asked me clarification questions and gave me possibilities for developing a mapping and submission tool that is student user friendly. In the end we settled on using Fusion Tables, which is a data visualization app, in conjunction with Google Maps to create an interactive and easy-to-navigate tool embedded right into our class blog. The structure of this is such that there is an interactive map of Greater Vancouver on the front page of our blog. And throughout the map, there are red markers at points selected by students for their examples. When users select a marker at a specific location, they can click a link that goes to the full blog post written by the student about the issue at hand. The blog also organizes the posts by category, so that users can see the overall range of content and subjects covered by the students.
In what ways has this changed the course?
Much of the reading and lecture content for the course discussed examples from many places. The assignment really lent an applied and local feel to the topic of environmental justice, which forced students to confront the fact that this issue is not located in far flung places, but that it exists here too, despite the constant marketing of Greater Vancouver as the best and the greenest city region in the world. In class, we also used student-generated examples to expand our discussion of concepts and to make linkages to readings. Student-generated examples allowed for an expansion of our collective repertoire of examples that we drew from to really beef up the content of the course. Students were thus also active participants in producing course content.
What were some of the challenges you’ve faced and is there anything about your approach you would improve or change?
There were a couple of main challenges. First, we were beholden to the limitations of the Google Maps technology that was the basis for the mapping and submission tool. For example, if different environmental justice issues were sited with the same location, the mapping tool will update the entry for that location with the more recent submission, disregarding any previous submissions. This assumed a one site = one issue approach, which cannot capture the complexity and multiplicity of environmental injustice. For example, the same local park can be both an amenity that drives surrounding property values, contributing to housing unaffordability, and a space for commemorating an important colonial figure, tying it to histories of settler colonial dispossession. Unfortunately, due to the technical limitation of fusion tables, we worked around this by asking students to first check that others have not written something about the site that they are analyzing, and if someone has, to ensure that they use a slightly different set of coordinates that still map closely enough to their site. Second, the mapping tool needs a very specific format of coordinates to map the points properly. Students were using different formats because they were familiar with multiple ways to express coordinates. In the future, it will be necessary to teach students the very specific format that is necessary for them to use in order for the mapping tool to map their site properly.
Do you have any advice for instructors hoping to implement this type of project in their course?
I would recommend starting early with the process of developing the mapping and submission tool with Arts ISIT. This will enable you to optimize the assignment submission process by identifying and ironing out issues early on.


